With New Orleans’ first COVID-19 deaths in March 2020, local pathologists autopsied victims in an urgent effort to tackle the emerging disease. But they faced a problem: Their high-resolution 3D digital microscopy scans of infected tissues comprised terabytes, too large to easily share or even analyze.
Enter scientific visualization researcher Brian Summa. The pathologists sent him their scans, which Summa integrated, deployed on a large visualization system, and analyzed with the medical experts’ guidance.
“It really hit me how needed I was as the glue when the pathologists moved into this large-data environment and how frustrating it must it be for other scientists who don’t have access to a large-data visualization expert,” says Summa, an associate professor of computer science at Tulane University, which hired him in 2015 while rebuilding its computer science department, mothballed since 2005’s Hurricane Katrina. “So a lot of my recent research has focused on trying to remove the need for a visualization expert in this loop,”
That experience is behind the vision guiding Summa’s five-year, $750,000 ASCR Early Career Research Program award project: accelerating visualization-based discovery with novel technologies that make even the largest petabyte-sized visual datasets easier to search, analyze and share.
Summa’s research is guided by a ground-floor view of digital-visualization development and the challenges in creating and sharing them.
As an undergraduate at the University of Pennsylvania, he was a photography lab technician at the Philadelphia Inquirer. “Photoshop was still pretty new in their workflow,” says Summa, who would develop film and then scan images before editing them on a computer.
But it was in graduate school at Penn that he realized what was possible with visualization science. “When I took my first graphics course, where you program something, and an image would appear on the screen – I was hooked. I realized that all the programs I’ve been using, like Photoshop, were all based on research.”
‘When I create an algorithm, I really care about it being able to scale.’
For his Ph.D. at the University of Utah’s Scientific Computing and Imaging Institute, Summa helped solve what’s known as the panorama problem in large-scale scientific mosaic images. He co-invented algorithms that accelerate joining frames without overlap and on-the-fly color correction of the thousands of images that compose a gigapixel panoramic picture. “I was really annoyed about how long it previously took,” he says. The technology is now used commercially for aerial image stitching.
Just as important, during his doctorate Summa found his guiding research vision: scalability.
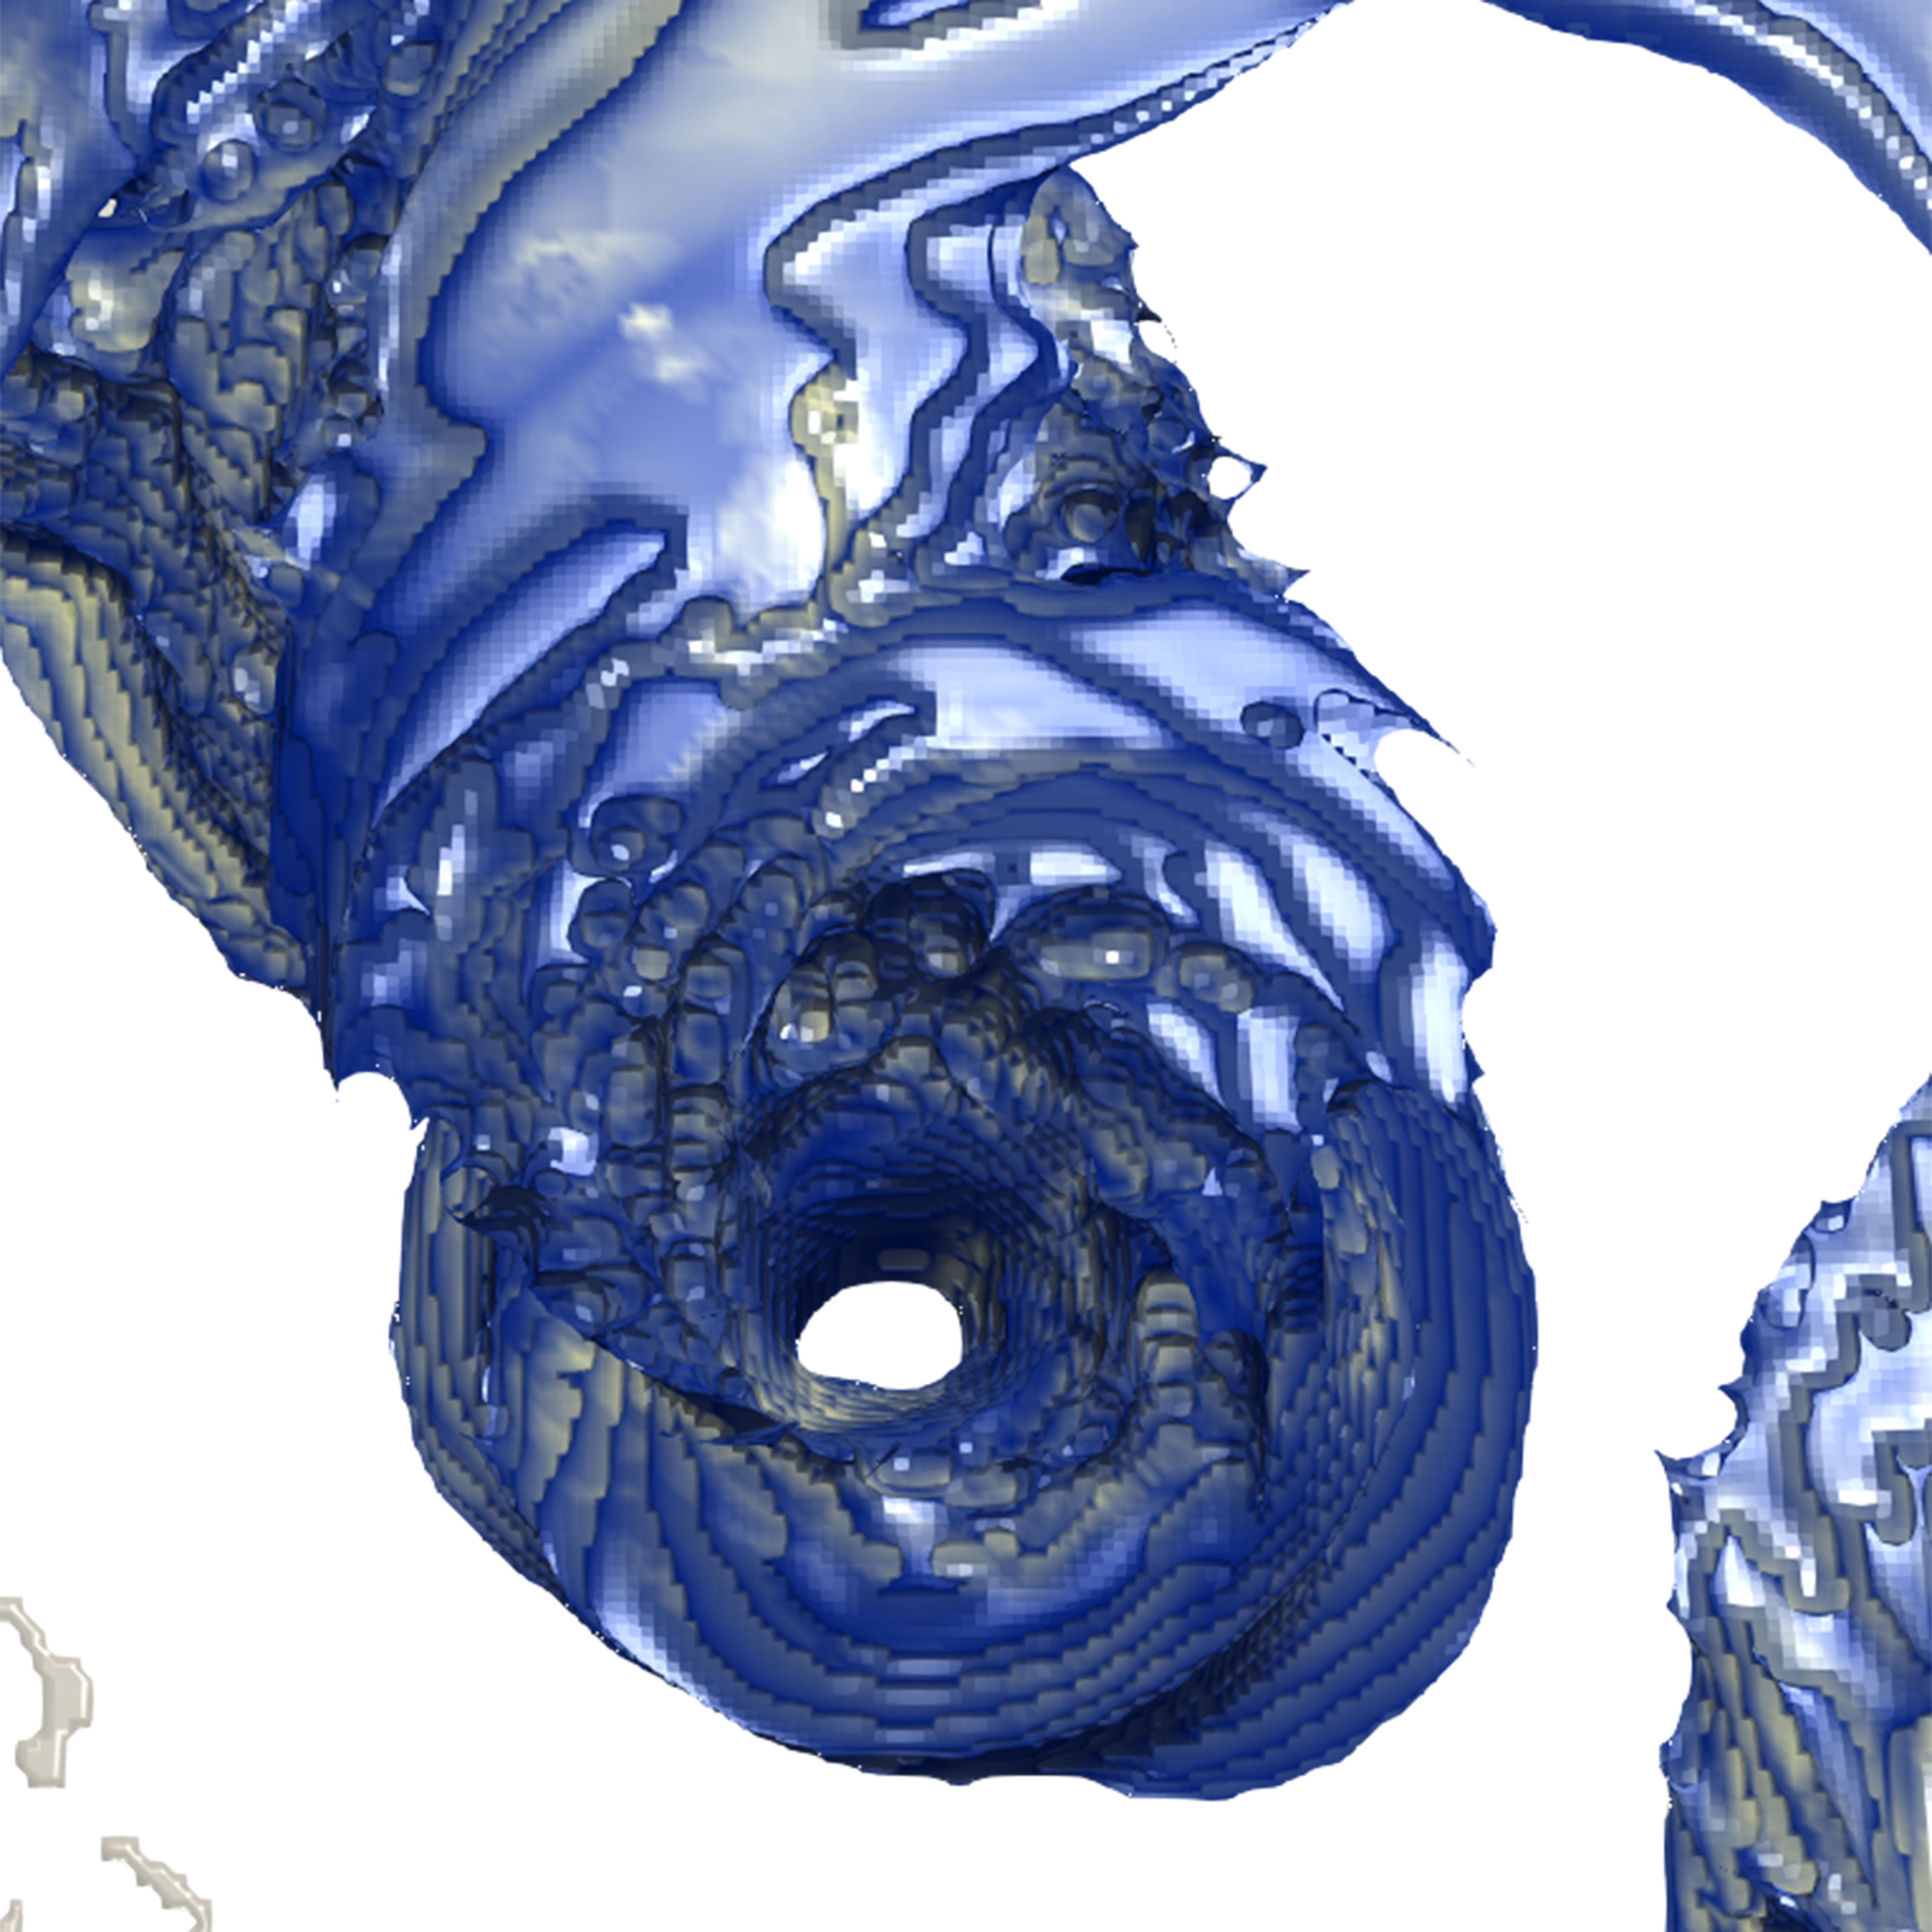
Isosurface from a simulation of Hurricane Isabella computed by the National Center for Atmospheric Research. Image courtesy of Guillaume Favelier, Noura Faraj, Brian Summa, Julien Tierny, from “Persistence Atlas for Critical Point Variability in Ensembles,” IEEE Transactions on Visualization and Computer Graphics 25, 1 (Jan. 2019), 1152-1162. (Presented at IEEE VIS 2018). Data from: 2004 SciVIS contest.
“For me, this is where the interesting problems are,” he says. “When I create an algorithm, I really care about it being able to scale. I care about people being able to use the same algorithm and analyze and use the data on their devices, whether that’s someone’s iPad, a laptop or a supercomputer.”
Now, with two graduate students his early career award supports, Summa is taking a three-pronged approach to further develop foundational technologies supporting visual dataset analysis and sharing at scale.
The first is to develop a scientific version of Google’s reverse image search. At present, researchers who want to comb and compare visual datasets – an advanced simulation, for example – do so via metadata tags attached to the information, rather than an image’s raw data content. With graduate student Demi Kim, Summa is developing a machine learning-based search method that creates a mathematical representation of the data’s topology, or internal structural relationships.
“It’s the fundamental structure that makes the dataset a dataset,” Summa says. “This would really make data searching more accessible. Rather than a scientist trying to figure out what feature they’re looking for, they can query large databases really, really fast, based on topological similarity.” He will beta-test the technique with terabyte-sized datasets from collaborators at Lawrence Livermore National Laboratory and the National Renewable Energy Laboratory.
Summa’s approach has a fascinating advantage: It’s applicable across domains, so researchers could discover similar, even universal, patterns in data from disparate fields. “What’s really interesting to me is whether a climate scientist could find, for example, combustion datasets that have similar properties.”
The second part of his research plan is prioritizing key information data contains to optimize transfers.
Scientists now use a variety of data compression techniques to aid transfer of massive datasets. This often means simply sending a lower-resolution version of the entire trove. Summa’s innovative idea is to develop “analysis-centric ways of reducing the data,” he says. As with topological similarity, this approach uses machine learning to identify key relationships in the data and then focuses on maintaining these when the information is reduced.
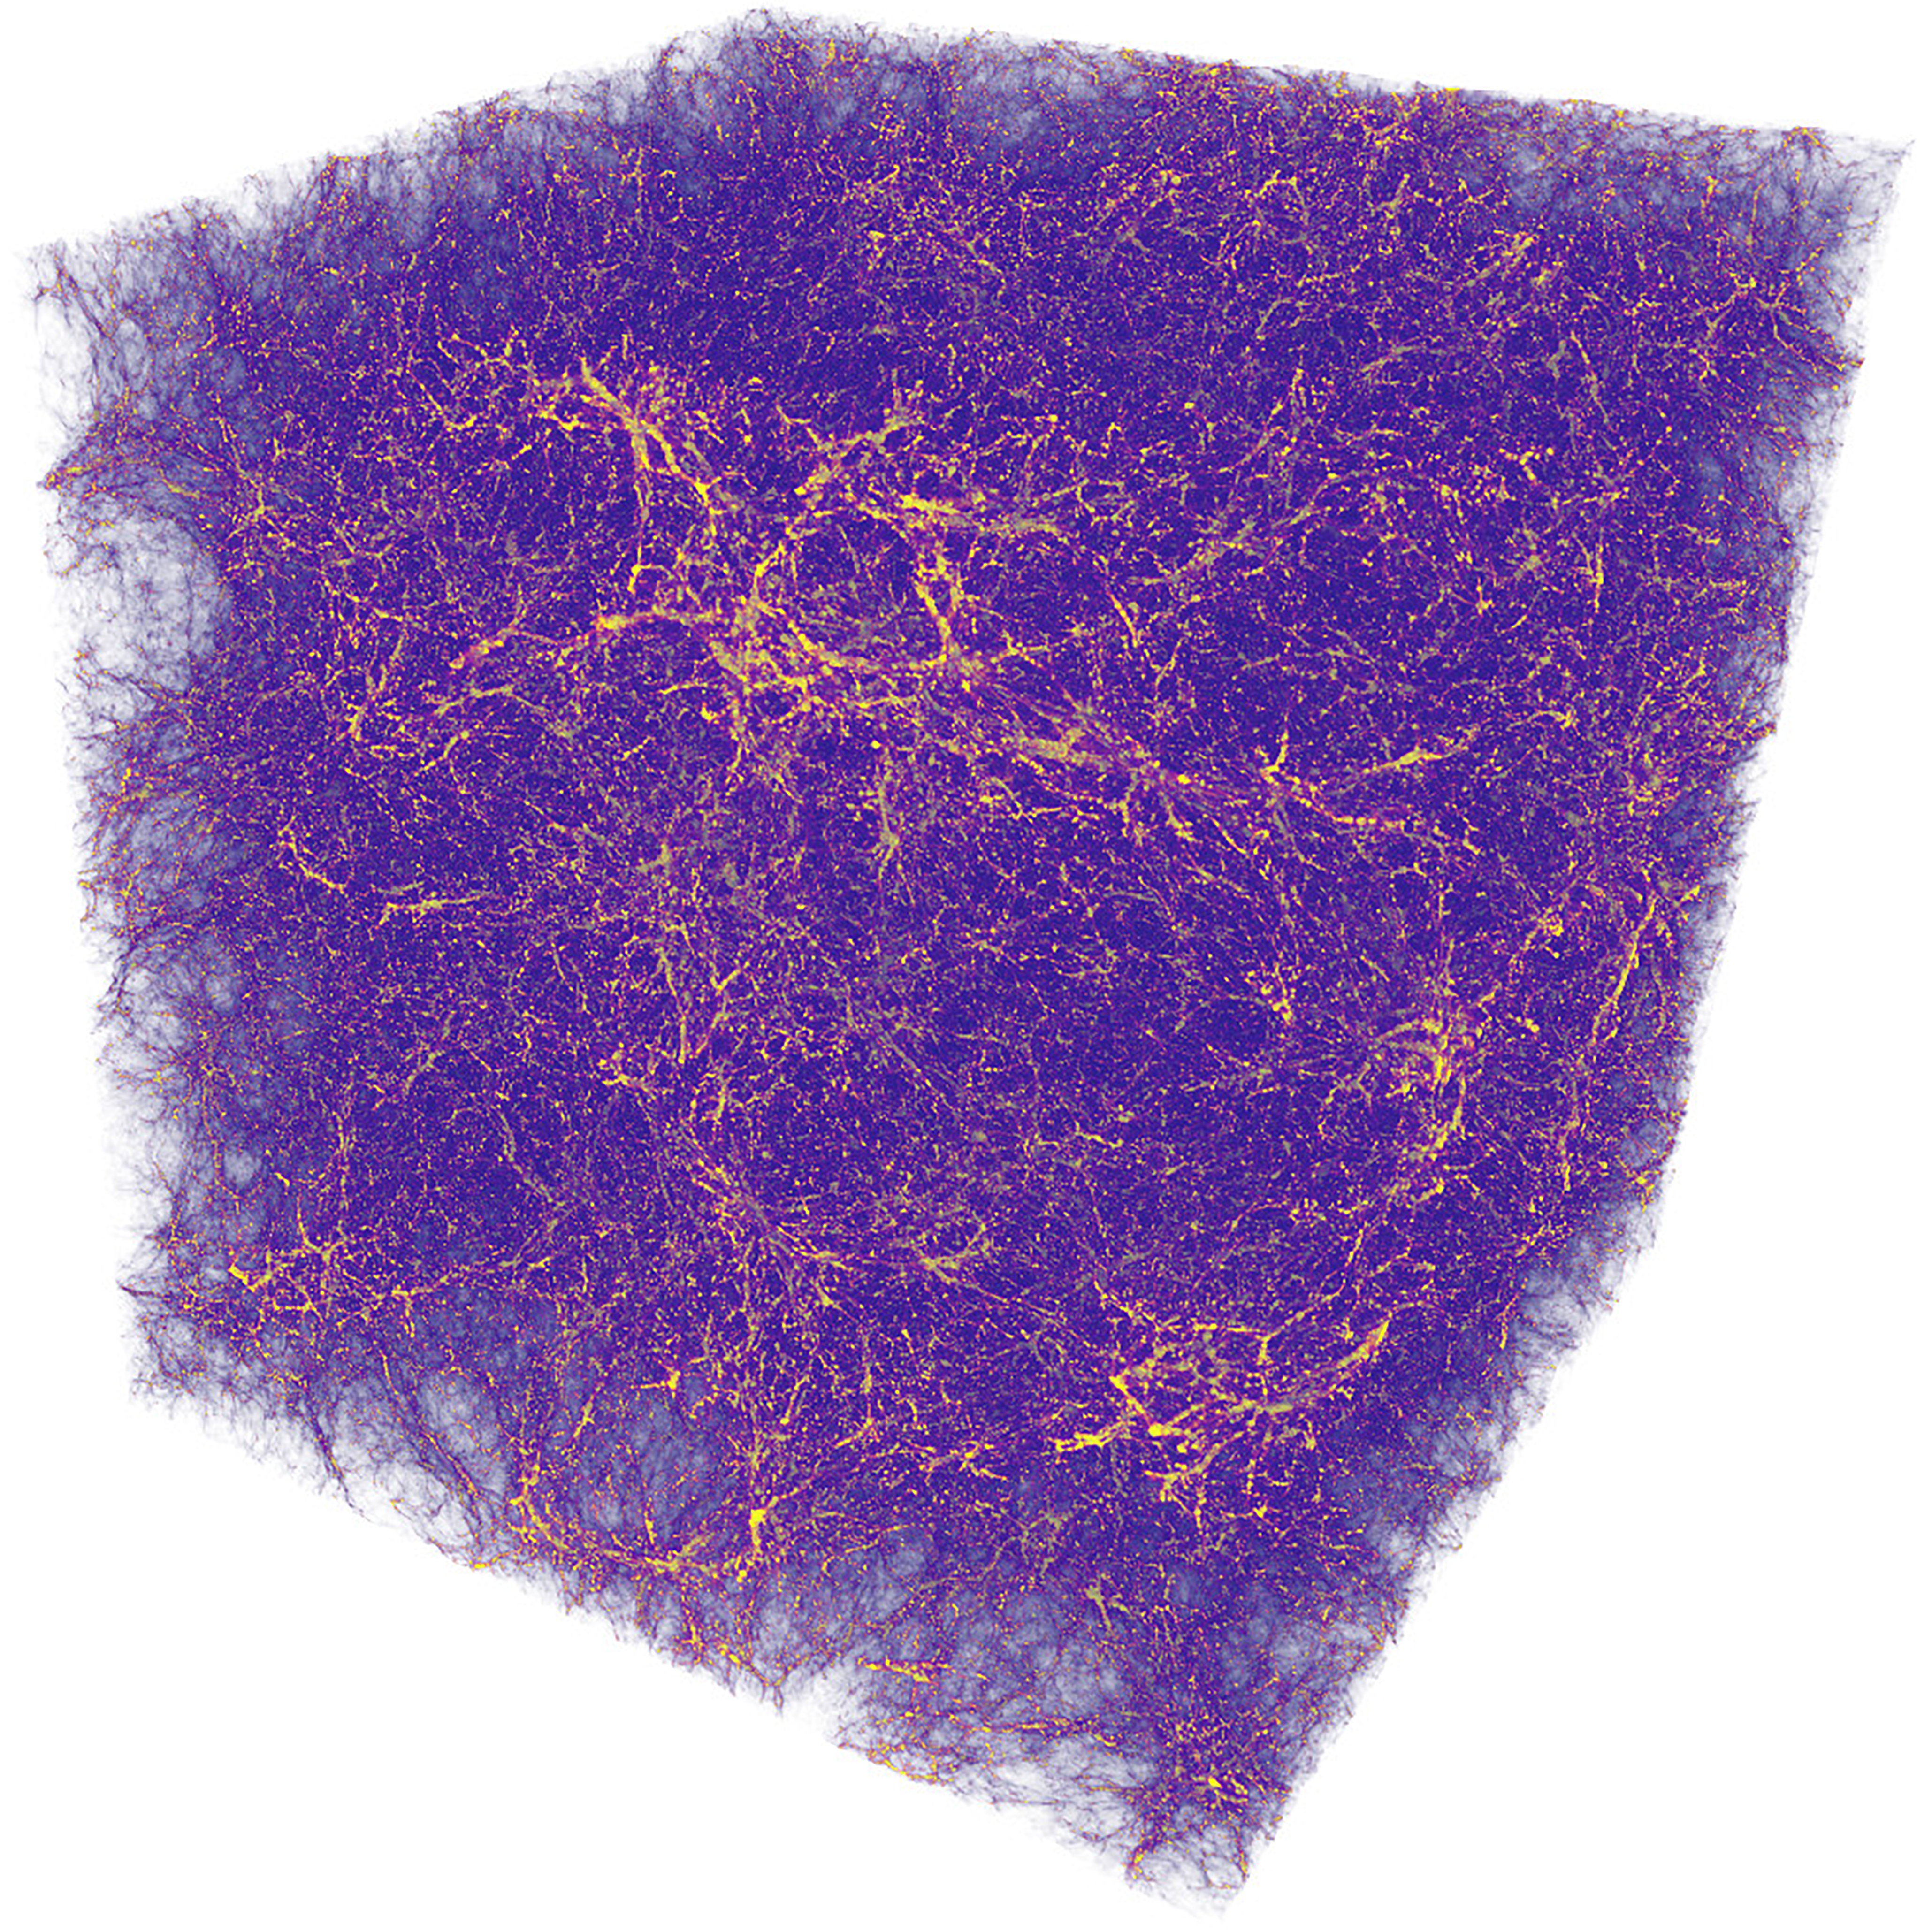
Cosmology simulation of dark matter. Data courtesy of A. Almgren, J. Bell, M. Lijewski, Z. Lukic, and E. Van Andel. From “Nyx: A Massively Parallel AMR Code for Computational Cosmology,” The Astrophysical
Journal, 765:39, 2013.
“What I want to design are approaches that transfer the right data, such that someone can do the analysis right away on their laptop and get the important information out of the analysis as quickly as you would if you just ran it on a smaller dataset.”
Finally, Summa will develop large visualization software systems that operate with point-and-shoot ease. Scalable visualization programs DOE researchers now use, such as OpenViSUS and VisIt, “require a large-data expert at the helm of the deployment,” he says. Even with this, the system must be implemented before it’s known how it performs.
Summa wants “to come up with a formal way of describing the complexity in these visualization systems so you can accurately predict their performance.” He’ll work with the architects of OpenViSUS and VisIt on the project. “Hopefully, if this formalism can do that, then we can build systems in which you don’t need a data expert to be able to deploy the system and have it run at peak efficiency.”
The COVID-19 response demonstrated how computational biology could enhance public health research. Though the pandemic… Read More
Diamonds aren’t just beautiful sparkly rocks or a girl’s best friend; they’re also the hardest… Read More
More than a century ago, scientists pondered how evolution might be driven by mutations caused… Read More
Scientists, industries and policymakers have been working for years to find energy storage technologies that… Read More
The human brain contains a vast expanse of unmapped territory. An adult brain measures only… Read More
Computer scientists are democratizing artificial intelligence, devising a way to enable virtually anyone to train… Read More