Scientists sometimes rebuff James Ahrens when he offers to help them analyze results from their high-performance computing (HPC) simulations of climate, chemical reactions or other phenomena.
“They say, ‘No, I’m just going to write out all my data’” and create visualizations from it later, says Ahrens, the Data Science at Scale Team leader at Los Alamos National Laboratory.
That traditional approach, however, is less tenable each year. Data files from today’s large-scale computer simulations can be as much as a petabyte – a million gigabytes – frustrating scientists’ attempts to move, store and analyze them.
Visualization – translating data into graphs or images – can help make sense of that information, but can demand as much time and skill as running the simulation itself. Researchers must develop computer scripts to find data they want and then laboriously analyze and render them into images.
Data analysis and visualization already is so time-consuming that researchers often limit how much they explore their results, hindering scientific discovery, Ahrens says. The problem will only get worse in the coming years as exascale computers about a thousand times more powerful than today’s best machines come on line. They’ll likely produce data sets measured in exabytes – thousands of petabytes.
“We do simulations and we want people to understand their science,” he adds, but “if we just keep putting out exabytes we’re going to have less and less understanding.”
Reducing exabyte data sets even by 10 or more orders of magnitude still could produce millions of images.
Ahrens and a team of researchers are developing a solution: produce data visualizations in situ – as the simulation runs on an HPC system – building an image database scientists can later use to analyze results. The team, including LANL’s John Patchett, David Rogers and Mark Peterson and Sébastien Jourdain and Patrick O’Leary of software company Kitware, described its approach last fall in a paper presented at the SC14 conference in New Orleans. The open-source program, called Cinema to evoke visual storytelling, now is available for download with complete documentation.
Under standard post-processing approaches, researchers first write all their data to long-term storage, such as disk drives. But with data sets in the terabyte and petabyte range, even this step consumes untenable amounts of computer time, slowing simulations.
The researchers next must choose which of the data they want to visualize and wait as the computer and software render them into images, a step that can take a few seconds or many minutes. The time demands and complexity discourage scientists from fully exploring their results, the paper says.
Cinema instead amortizes visualization, spreading it through the simulation as it runs, and stores the resulting images in a database. “You do all that on the supercomputer, where you have the compute power to handle the creation of this imagery,” Ahrens says.
Image files typically are several orders of magnitude smaller than the original data, so they move to storage more quickly. More importantly, the data set researchers must examine effectively shrinks.
Data reduction or compression algorithms, like JPEG or MPEG, are common, but Cinema’s approach is science-driven Ahrens says: Researchers set the parameters. “We want to compress in a way that we get out science knowledge – which may or may not be the same as how we change the audio on a pop song.”
When investigators later analyze their results, images are easily accessible and load quickly. “You actually can go look at the images you generated and ask questions like ‘Which is the best?’” Ahrens adds. Under the usual post-processing approach, “you’re putting it all on the user to go through interactively and try to find the best image.”
The Cinema framework is built on ParaView, an open-source visualization and analysis tool Ahrens helped create, but can be used with other such software, like Lawrence Livermore National Laboratory’s VisIt. To implement Cinema, simulation researchers first use test data to define visualization operators, such as what information the program should display and how to display it: in a contour, histogram or other format. That information is saved in a file.
Defining operators up front demands a different mindset than the usual post-processing approach, Ahrens says. Visualization operators are “the pieces of the question you want to ask” and require scientists to consider what information they want and what they want to do with it. Simulations, like experiments, will be aimed at examining specific hypotheses and finding specific results.
With Cinema’s graphical user interface, the researcher next decides on other, more advanced aspects to produce the simulation output: how often to perform the in situ analysis, what visualization and analysis objects to create, and other factors. The user also decides things like the number of angles from which images are captured, the resolution as determined by how the data are sampled, and the image format.
The last few factors largely determine how much storage the image database will consume. The Cinema interface estimates the size of each image, the total data storage needed, and the added compute time needed to create them. By adjusting the sampling rate and other factors, researchers can tweak the data set to fit the available storage and time.
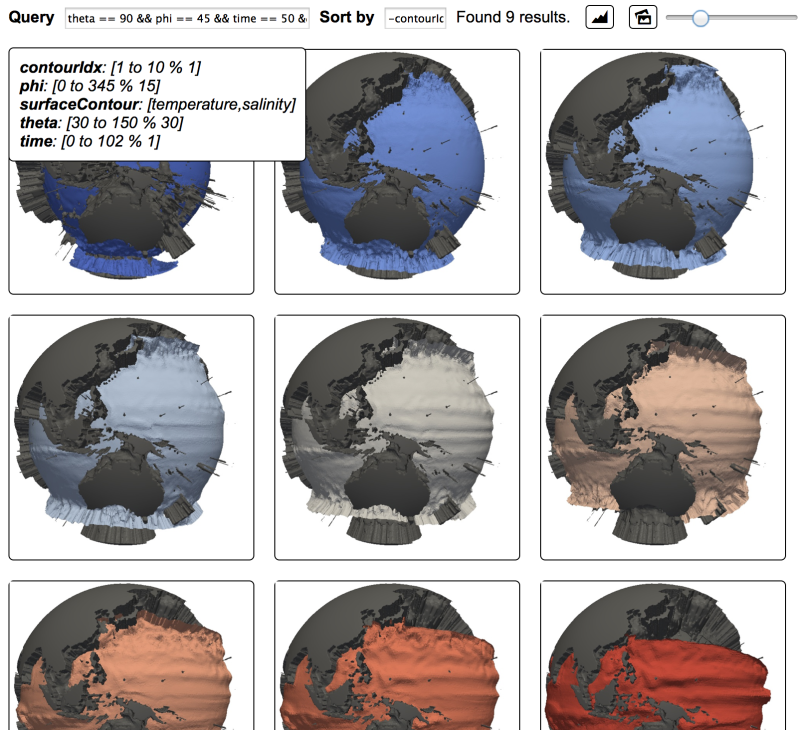
The interface generates a computer script that implements the researcher’s instructions. As the simulation runs, the script produces images capturing its state at specific time intervals and sends them to a database. It also captures metadata – information about image properties that helps make them searchable – and other details. And the script creates URLs, allowing researchers to find and share the database via a Web browser.
Researchers can access the database to call up images of specific objects, seen from specific angles, at specific points in the simulation. They also can combine images to make animations or composites.
Generating images as a simulation runs adds to the computational workload, but Ahrens and his colleagues say the increased time required remains constant even as the simulation size and number of processors increases.
The team also created software tools that use metadata to interactively search the image database. It’s a key capability: Reducing exabyte data sets even by 10 or more orders of magnitude still could produce millions of images.
Cinema’s search capabilities are even more advanced, Ahrens says. It also can count the number of image pixels that are assigned particular values, like temperature. Researchers can query the database to find images containing the most pixels with specific values or ranges of values. The program can decide which visualization is best to display based on what the researcher wants to find. “People have not done that kind of reasoning before,” he adds. “It can analyze the database you have and say ‘These images give you what you’re looking for.’”
Information on Cinema is available at the LANL Datascience website. Collaborators, both in the United States and internationally, are using the initial release and providing feedback. With assistance from interns, LANL recently compiled full documentation to support the code for download.
Climate researchers at Los Alamos have already tried Cinema. They’re keen on its Web interface because it allows them to immediately share data without downloading and analyzing large files. They’re also enthusiastic about Cinema’s new capabilities for image-based data analysis. The only question they ask, Ahrens says, is “Why don’t we have this right now?”