Concrete is a $100 billion business in the United States. The material is used for all manner of structures, from roads and bridges to buildings. So it’s hard to imagine that such a common and ubiquitous material could still hold secrets.
Yet knowledge about concrete flow is typically based on construction crews’ practical experience preparing a mixture of local ingredients: cement, sand and rock. These components can vary widely in shape and chemical composition in different regions, making concrete mixtures diverse.
One common on-site assay, the slump test, measures how far a conical pile of fresh concrete spreads over time. The mixture is adjusted on the fly, like adding milk to cake batter so it stirs faster, says Nicos Martys of the National Institute of Standards and Technology (NIST) in Gaithersburg, Md.
Martys, a physicist in the Materials and Construction Research Division, is part of a NIST team formulating a theory on how concrete components interact as they flow.
With a renewal award from the Department of Energy’s Innovative and Novel Computational Impact on Theory and Experiment (INCITE) program, NIST researchers are using 750,000 processor hours to simulate viscosity, yield stress and other fundamental concrete flow questions.
Accurate concrete flow simulations and a better understanding of the effects of different additive materials could lead not only to sturdier buildings but also a better environment.
Concrete’s strength depends on the amount of cement used, but cement processing from limestone accounts for up to 4 percent of the carbon dioxide humans release into the atmosphere.
Although finished concrete structures absorb some carbon dioxide and reduce the overall carbon footprint, concrete companies would like to find ways to build strong concrete using less cement and perhaps incorporating industrial waste materials such as fly ash from coal combustion or slag from steel production.
NIST researchers suggest that whatever ingredients end up in a more earth-friendly concrete, they have found a formula for assessing a mixture’s strength by combining physical theory, powerful computers and, not least, a way to see inside their simulations.
Researchers want to ensure that simulation data matches what people actually see in concrete.
One of those researchers, Ed Garboczi, says fundamental concrete research remains a juggling act, sitting at a juncture where basic science meets engineering applications.
“Working on concrete, we’re sort of in a gray area,” says Garboczi, leader of NIST’s Inorganic Materials Group of the Materials and Construction Research Division. “We need to do fundamental science to understand concrete because it’s so complex, but most of the world thinks concrete is something that you mix in the bag and dump in a hole.”
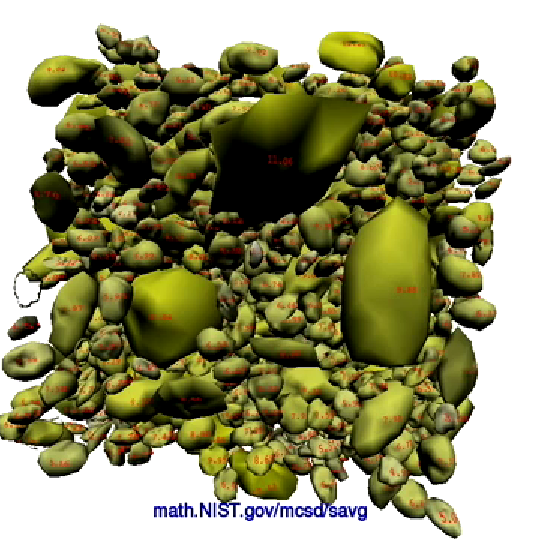
Concrete is a mixture of cement, water, fine and coarse aggregate (sand and gravel) and chemical additives. Changing the proportion of ingredients in the concrete recipe can add strength or durability but also can increase costs or reduce workability. The National Institute of Standards and Technology set up the Virtual Cement and Concrete Testing Laboratory to predict the behavior of concrete using computer models and visualizations like this one. National Institute of Standards and Technology: W.L. George, N.S. Martys, J. Lancien, S.G. Satterfield, M. Olano, E. Garboczi and J. Terrill
These studies are particularly challenging because concrete contains particles of many sizes. Cement particles are made from a crushed combination of limestone, shells, chalk, clay and slate. The smallest cement particles can be submicron, while the largest in the full concrete mixture, which includes rocks and gravel, can be roughly 100,000 times that size &ndash a few centimeters in diameter. With such a span in scales, tracking the behavior of both types of particles at the same time without a supercomputer would be impossible, much like following individual football fans from a blimp above a packed stadium. Modeling such a large range of particle sizes makes parallel computing a necessity.
To address particle variability, researchers need a large modeling space, and they must set up a multiscale system that characterizes the chunky-ice-cream-like mixture in several stages. Imagine concrete is a scoop of rocky road: Modelers first must understand the forces at work in the plain chocolate ice cream before they mix in larger components &ndash the concrete equivalents of marshmallows or nuts.
In concrete, the first ingredient is cement &ndash tiny calcium silicate particles mixed with water. This wet cement mixture serves as the fluid in which sand &ndash the next particle size up &ndash is simulated to yield the properties of mortar. Finally, the modelers add rocks to the mortar for a complete picture of concrete. Running on the Blue Gene/P computer at DOE’s Argonne National Laboratory near Chicago, they can model the interactions of up to 100,000 “suspended groupings” &ndash the large particles &ndash in the mixture and up to 1 million fluid (small) particles.
The team’s computations are examining the details of how those suspended groupings interact. To describe such a complicated mixture, the researchers use algorithms based on dissipative particle dynamics (DPD). Similar to molecular dynamics (MD), another set of algorithms used for molecular interaction simulations, DPD allows researchers to model the motion of complex mixtures, such as cement or mortar, as “particles” that interact with larger components such as rocks.
The team’s main interests are viscosity and yield stress. Because concrete is a non-Newtonian fluid, the viscosity (thickness of its flow) varies with the relative motions of the particles that come into contact as it moves. Yield stress refers to the amount of force required for a material to flow.
At each stage of the calculation, the researchers must validate their findings against similar theories or, more often, by experimenting with concrete, NIST computer scientist Bill George says. They want to ensure that simulation data matches what people actually see in concrete.
Although some validation data comes from experiments their group conducts, the research also is supported by the Virtual Cement and Concrete Testing Laboratory. The laboratory is a consortium that works with NIST groups, various concrete companies and associations and government agencies such as the Federal Highway Administration. These partners can test what the NIST researchers have learned with specific concrete mixes. The fundamental computational models from NIST help the concrete industry understand the rheological parameters &ndash viscosity and shear stress &ndash their equipment experiences as concrete is mixed, poured and pumped.
Exploratory visualization is another critical part of model validation. The images NIST physicists, computer scientists and visualization experts create allow researchers to “stick their heads in a bucket of concrete,” says Steve Satterfield, who helped develop the institute’s immersive visualization software platform.
This virtual concrete bucket reconstructs their computational results in a three-dimensional space &ndash an “immersive visualization environment,” with walls and screens that form a corner and a floor. Researchers wear virtual reality goggles that process stereo images projected on the walls. Like other virtual reality technology, the goggles contain a transmitter that tells the computer where the observer is and where he or she is looking.
In this immersive visualization environment, Satterfield and George have demonstrated a volume of flowing concrete, with moving rocks surrounded by an invisible fluid, and mortar. Most simulations of complex mixtures use uniformly shaped particles such as spheres or ellipses. That’s impractical in concrete models because rock shapes can profoundly affect flow properties. For example, concrete that uses smooth riverbed rocks flows more easily than concrete that incorporates rough-hewn quarry rock. The group’s simulation now includes realistic models with varying sizes and rough shapes that John Hagedorn and Garboczi of NIST developed from images of real rocks captured with X-ray microtomography.
But simulating the interactions of irregularly shaped particles adds a level of computational bookkeeping to track the points and shapes of the rocks, George says. With a spherical particle, for example, the researchers just needed to know the position of its center and its radius. The extra details of realistic rock shapes have increased the computational size of these simulations 10-fold. The group relies on visualization to troubleshoot the initial calculations and see that rocks aren’t colliding or moving through each other in space.
The immersive environment and its associated tools let the researchers look at the system as a whole and examine interactions layer by layer, frame by frame. They can label and graph the stresses on each rock and series of rocks, then color-code them accordingly, giving greater stresses a darker color.
Using visualizations, George says, the NIST team has observed that groupings of larger rocks tend to be under the most stress, and the physical mechanisms don’t match what’s been reported. Because groups of rocks appear to carry the stress, their arrangement is important. The compression and extension of materials in the flow also may contribute to the overall yield stress in the system.
“Visualization suggests a new way to analyze the data,” says Martys, the NIST physicist. “It gives you focus.”