Midwesterners needn’t bother choosing their poison: droughts or floods. They get a double dose of both.
The region is experiencing what weather experts call a flash drought, says Rao Kotamarthi, who heads climate and earth system science at the Department of Energy’s Argonne National Laboratory near Chicago.
“One of the clearest indicators of climate change is that you get intense periods of precipitation,” he says. The Midwest today can experience intense downpours with drought-like conditions lasting for several weeks in between. “Now some farmers actually have to start irrigating even in northern Illinois, which is a big change from before.”
Kotamarthi’s team published climate-modeling data in Scientific Reports last year that could help U.S. policymakers better anticipate droughts and floods. The paper expands upon an Argonne-AT&T collaboration that led to a 2019 AT&T white paper, “The Road to Climate Resiliency,” focusing on the southeastern U.S. AT&T and DOE’s Biological and Environmental Research and Advanced Scientific Computing Research programs supported the latest work.
The project also led to release of a Climate Risk and Resilience Portal (ClimRR), developed by Argonne’s Center for Climate Resilience and Decision Science in collaboration with AT&T and the Federal Emergency Management Agency. ClimRR lets users explore future precipitation, temperature and wind for the continental U.S. at high spatial resolution.
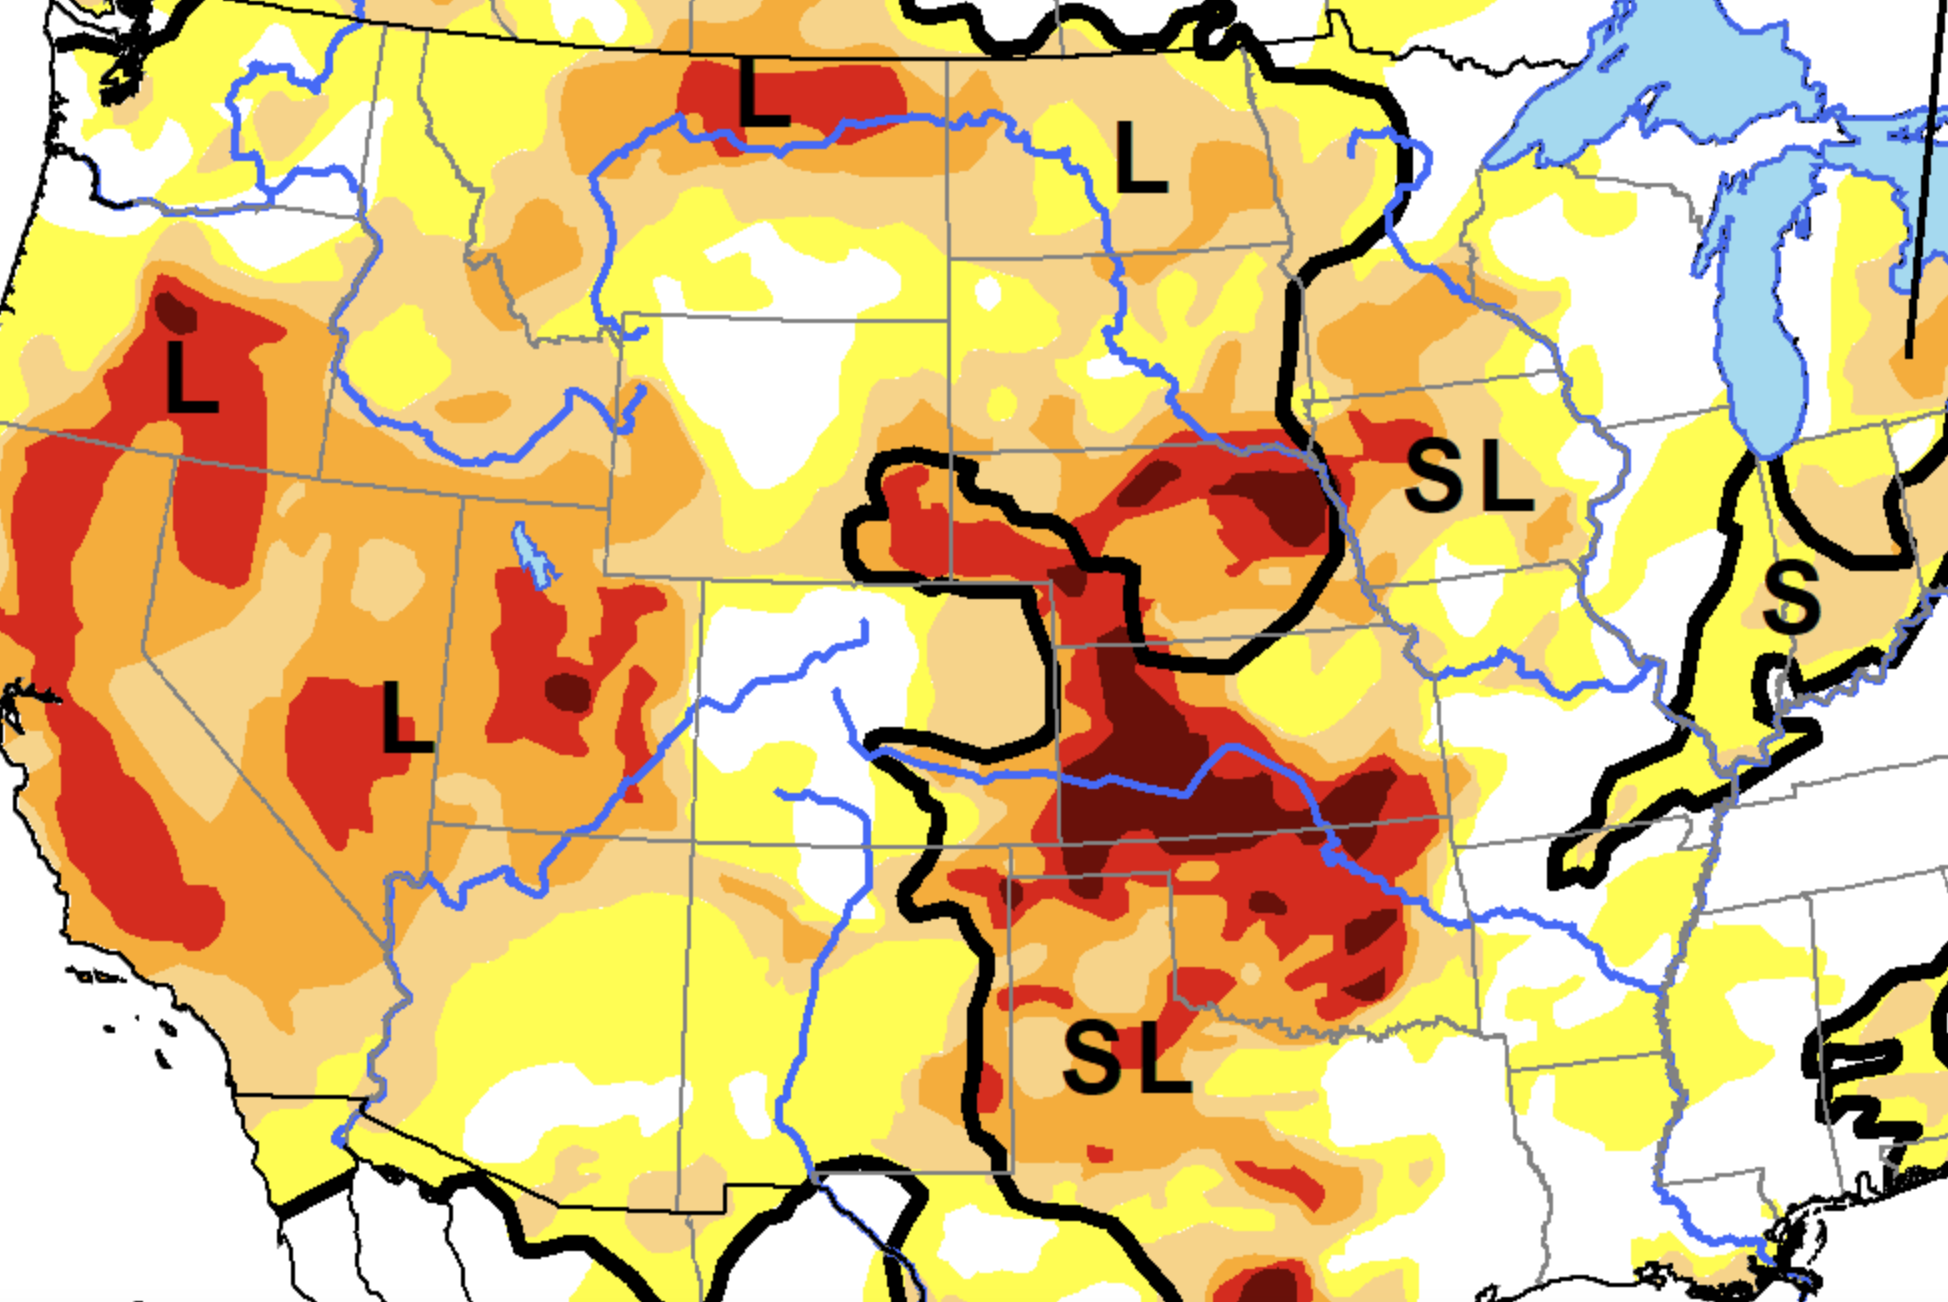
Standardized Vapor Pressure Deficit, a drought index devised by Argonne National Laboratory to predict rapid drought onset. From left: winter, spring, summer, fall. Image courtesy of Brandi Gamelin, Argonne Natiional Laboratory.
There are more than 50 metrics for gauging when a drought occurs – factors such as temperature, precipitation and evapotranspiration. None of them, however, can quickly project drought onset. The Argonne team has established the Standardized Vapor Pressure Deficit drought index (SVDI) to do just that.
“You can calculate vapor pressure deficit with temperature and relative humidity. It doesn’t include precipitation,” says Argonne’s Brandi Gamelin, lead author of the Scientific Reports paper. Instead, it includes a measure of evaporative demand.
“If you have higher evaporative demand, it’s going to pull more moisture out of vegetation and the soil,” drying them, she says. The team also produced a separate wildfire index that is highly correlated to SVDI. In fact, SVDI also works for drought.
Many indices rely on measures of reduced rainfall to define drought. But “We can go months in many California locations without rainfall,” says Gamelin, a native of the state. “It’s difficult to use the same measure in California than you would use, say, in the Midwest related to drought and agriculture or wildfire risk.”
Gamelin compared her new drought index against other available measures and showed that it works just as well.
‘This is useful in the bigger context as climate change increases flash droughts.’
“Her models gave us confidence that this is a good way to go,” Kotamarthi says. “Vapor pressure deficit is not complicated either to model or measure. One of the things that we push in the paper is how this is useful in the bigger context as climate change increases flash droughts.”
The models forecast climate change at a high spatial resolution, calculating projections for areas measuring 12 square kilometers (4.6 square miles). The team ran the code on supercomputers at the National Energy Scientific Computing Center at California’s Lawrence Berkeley National Laboratory, and at the Argonne Leadership Computing Facility.
The team aims to tighten the resolution to four square kilometers (1.5 square miles). That would generate about 4 petabytes of data, the equivalent of 200 billion pages of text.
The goal: help zoom in the global climate model, which operates at a scale of 10,000 square kilometers (3,861 square miles), to 100 square kilometers (38.6 miles) and now to around 16 square kilometers. The simulations focus on extreme and quickly occurring events, generating data at three-hour intervals.
The Scientific Reports paper projected the frequency of droughts that happen once in 10, 25 and 50 years. A 50-year drought, for example, has a 5% chance of happening and would be widespread, affecting the Midwest, Southwest and Northwest. “The areas affected by drought do increase,” Kotamarthi says. “By mid-century, you see larger portions of the Midwest experiencing drought in general.”
Since publishing its drought index, the Argonne team has applied new machine-learning methods to identify both short-term and long-term drought. The team caps projections at 50 years to keep uncertainty values within reasonable limits.
Last year’s study focused on a short-term drought index that worked well, Gamelin says. “Now we’re looking to understand long-term drought better with it.”
A new study will test the index to see if it can identify where and when droughts happened between 1980 and 2021 and probe more deeply into why they began and ended. Then the researchers will apply the methods to projecting future droughts.
Drought can dry the soil but so can wildfire. The heat from wildfires forms a barrier on mountain slopes, resulting in hydrophobic, or water-repellent, soils “so, you have a higher risk or incidence of flash flooding,” Gamelin says. These conditions often lead to droughts and floods happening in tandem. Water flowing downhill also lubricates debris flows, adding to the calamity. “That’s a risk up and down California in the mountains and hills.”
Kotamarthi and Gamelin stress the importance of quantifying uncertainty when considering models of future droughts. “These are projections. They’re not predictions,” Gamelin says.
To calculate uncertainty, the team statistically samples time series and location data 500 times from the Argonne model and three others that are widely used. Each new series then undergoes an extreme value analysis to create a range of minimum and maximum values. The uncertainty figures may help policymakers decide how best to plan for extreme events of varying magnitude.
“Money is not unlimited,” Kotamarthi says. “You may want to make your system resilient to a 50-year drought or a once-a-year drought. We are hoping that this kind of information provides decision-makers some points to think about.”